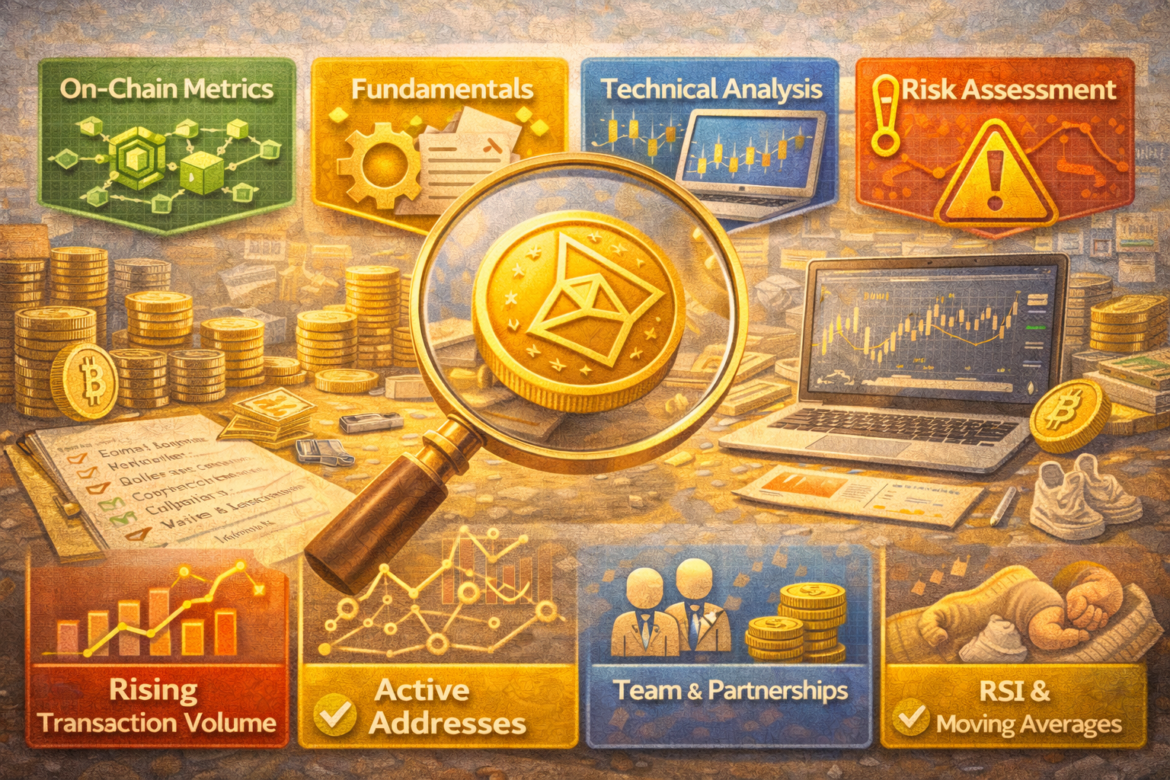
Hey there, crypto curious! If you’ve dipped your toes into the wild world of altcoins, you know it’s like a rollercoaster ride—thrilling ups, stomach-dropping downs, and plenty of “what just happened?” moments. Altcoins, those fun alternatives to Bitcoin, promise moonshots but come with real risks. The big question on everyone’s mind: Are there specific indicators or metrics to gauge an altcoin’s risk and potential? Absolutely, yes! In this post, we’ll break it down with easy-to-spot tools that help you separate the gems from the duds. No jargon overload—just straightforward advice to boost your confidence. Let’s dive in and make smarter picks together.
Key On-Chain Metrics: The Blockchain’s Hidden Clues
Think of on-chain metrics as the altcoin’s vital signs. They come straight from the blockchain, showing real user behavior that you can’t fake. These numbers reveal if a coin has genuine buzz or if it’s just hype.
First up, transaction volume. This tracks how much the coin is actually moving around daily. High volume means lots of people are buying, selling, or using it—not just hodling in fear. For example, if an altcoin like Solana spikes in transaction volume during a market dip, it signals strong demand and lower risk of a total flop. Aim for coins where volume consistently beats their average over 30 days. Tools like CoinMarketCap or Glassnode make this a breeze to check.
Next, active addresses. This counts unique wallets interacting with the coin. More active addresses? That’s a crowd forming, hinting at real adoption and growth potential. A coin with 10,000+ daily active addresses is flexing muscle, while one stuck at hundreds screams “ghost town.” Watch for steady growth here—sudden spikes might be bots or pumps, raising red flags for risk.
Don’t sleep on total value locked (TVL), especially for DeFi altcoins. TVL shows cash staked in protocols built on that chain. High TVL, like Ethereum’s rivals pulling in billions, points to trust and utility. Low or dropping TVL? High risk of users fleeing.
These metrics cut through the noise. Pro tip: Compare them to Bitcoin’s baseline. If your altcoin lags badly, pump the brakes—it’s riskier than a meme coin party.
Fundamental Indicators: Checking the Coin’s DNA
Metrics are cool, but fundamentals are the heart. These dig into the project’s guts, helping you spot long-term winners from short-term gamblers.
Start with team and development activity. A rockstar team with proven track records—like ex-Googlers or blockchain vets—lowers risk big time. Check GitHub for commit frequency; 50+ commits weekly means devs are grinding, not ghosting. Projects like Chainlink shine here, with transparent roadmaps and regular updates.
Market cap and liquidity are your safety nets. Low market cap (under $100M) screams high potential but sky-high risk—easy to manipulate. Pair it with liquidity: Can you buy/sell big chunks without tanking the price? Use DEX screener for this. A healthy ratio? Green light for potential.
Tokenomics matter too. Look at circulating supply vs. total supply. If 90% is circulating, dilution risk is low. Fully diluted valuation (FDV) helps: Divide FDV by market cap. Under 2x? Undervalued gem. Inflationary supplies? Tread carefully—they erode value over time.
Partnerships and real-world use cases seal the deal. Is the altcoin powering NFTs, payments, or AI? Adoption by big names like Visa or Tesla boosts potential massively. Skip coins with zero utility; they’re lottery tickets.
Technical Analysis Tools: Reading the Price Charts Like a Pro
Charts aren’t crystal balls, but smart TA metrics flag risks and upsides early. Keep it simple—no need for a finance degree.
Relative Strength Index (RSI) spots overbought or oversold coins. RSI above 70? Too hot, high crash risk. Below 30? Potential bargain with rebound upside. Pair it with Bitcoin’s RSI—if your altcoin’s RSI is climbing while BTC’s flatlines, that’s outperformance potential.
Moving Averages (MA) smooth the chaos. The golden cross (50-day MA crossing above 200-day) screams bullish potential. Death cross? Run for cover—high risk ahead. For altcoins, watch the 20-day MA for quick swings.
Volume-weighted average price (VWAP) is underrated. It shows true value based on volume. Price hugging VWAP? Stable, low risk. Wild deviations? Volatility alert.
MACD (Moving Average Convergence Divergence) tracks momentum. Positive histogram bars mean building strength—great for potential plays. Divergences (price up, MACD down) warn of reversals.
Bonus: Fear & Greed Index for the altcoin’s ecosystem. Extreme fear? Buying opportunity. Greed overload? Risky peaks.
Risk Assessment Metrics: Spotting the Danger Zones
Potential is fun, but risk metrics keep you from wiping out. These red flags scream “caution!”
Volatility index. Altcoins swing wild—check 30-day volatility. Over 100%? Thrilling but risky for your stack. Stable under 50%? Safer bet with growth room.
Beta coefficient. Measures how much the altcoin dances with Bitcoin. Beta over 2? It amplifies BTC moves—double the pain in bears. Beta under 1? Defensive play with upside.
Sharpe ratio gauges returns per risk unit. Above 1? Efficient potential. Negative? Value destroyer—avoid.
Holder concentration. If top 10 wallets hold 50%+ supply, whale dumps loom large. Tools like Etherscan show this; diverse holders mean lower rug-pull risk.
Network hash rate for proof-of-work alts: Dropping hash rate? Miners fleeing, security at risk.
Stack these with sentiment from LunarCrush—social buzz without fundamentals is fluff.
A Simple Checklist for Altcoin Wins
Ready to hunt? Here’s your no-BS checklist blending everything:
- On-chain: Rising transaction volume, 5K+ active addresses, solid TVL.
- Fundamentals: Active GitHub, low FDV/MCap ratio, real partnerships.
- TA: RSI neutral, MA bullish, positive MACD.
- Risk: Volatility <80%, beta <1.5, Sharpe >0.5, decentralized holders.
Example: Cardano (ADA). Strong dev activity, growing active addresses, partnerships galore, and tame volatility—classic low-risk, high-potential profile.
Polkadot? TVL beast with parachain utility, but watch holder concentration.
Meme coins like Doge? Sky-high volatility, low fundamentals—fun lottery, not investment.
Track weekly via Dune Analytics dashboards. Set alerts on TradingView. Backtest with historical data.
Remember, no metric is perfect—combine 5+ for conviction. Diversify across 5-10 alts matching this profile.
Empower Your Altcoin Adventures
There you have it—crystal-clear indicators and metrics to assess altcoin risk and potential. From on-chain pulse-checks to TA chart reads and risk radars, these tools turn guesswork into smart plays. You’re now equipped to spot the next 10x without the wipeouts. Crypto’s volatile, but informed picks make it exciting, not scary.
Start small, DYOR always, and never invest more than you can laugh off. What’s your next altcoin check? Drop it in the comments—let’s chat!